Bathymetry (from the Ancient Greek "bathys" meaning "deep") is the science which studies the relief and depth of the oceans. It aims to map the seabed.
What is measured and how?
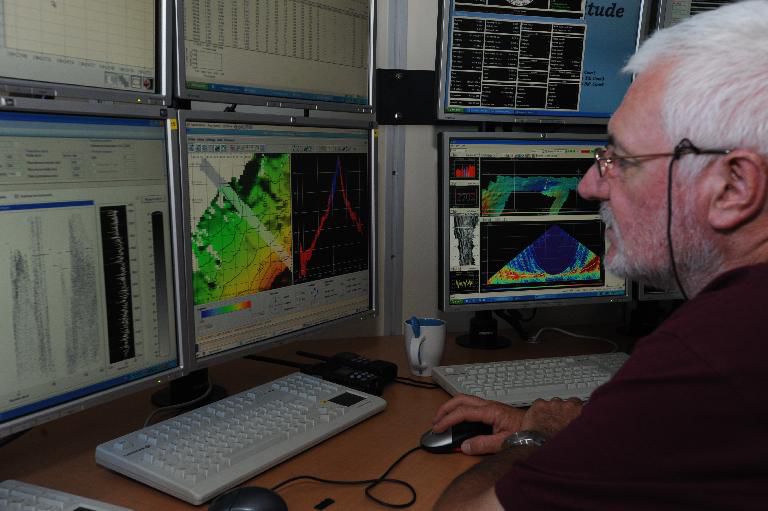
To explore the seafloor, oceanographic vessels and underwater vehicles are equipped with multibeam echosounders. These acoustic systems provide several types of data:
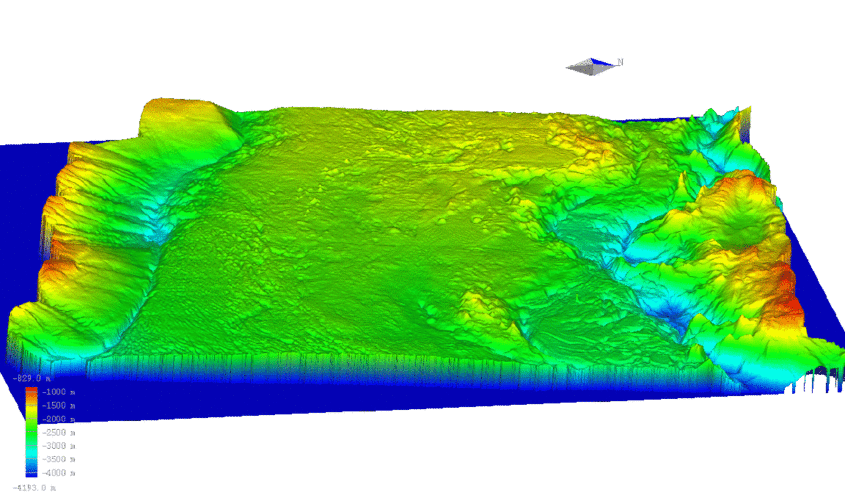
- topographic surveys of the seabed relief (bathymetry)
- sonar images showing the local reflectivity of the bottom, thereby determining its type (imagery)
- images showing the amplitude of the signal in the water column.
The multibeam echosounder sends acoustic pulses out below the vessel and listens to the echoes returned by the obstacles encountered. The distance is then obtained by measuring the time elapsed between pulse emission and reception of the echo. This determines the depth and typology of the relief.
This echosounder simultaneously measures the depth in several directions, which means that a wide swath can be explored (around 5 to 7 times the depth) at very high resolution.
To more fully understand how acoustic echosounders work, see:
- Ifremer's Marine Geoscience website and the study "Swath mapping system processing: Bathymetry and cartography " by Jean-Francois Bourillet, Christian Edy, Rambert F, Catherine Satra, Benoit Loubrieu (1996).
- the website of the Ifremer fleet with an animation of a multibeam echosounder and the presentation of multibeam echosounders.
File types
File type |
Vessel |
Extension |
Date |
Format |
multibeam bathymetry |
all vessels |
- |
NetCDF |
|
vertical bathymetry |
Offshore vessels / Thalia |
from 2009 for the Atalante |
NetCDF |
|
vertical bathymetry processed |
The Atalante, the Suroît, the Pourquoi pas ? |
- |
ASCII |
More information on file formats for geophysical data archived at SISMER.
Examples of sensors used
- Multibeam bathymetry
- Deep ocean:
- GIC SEABEAM from 1977 to 1990 onboard the R/V JEAN CHARCOT
- SIMRAD EM12-Dual since 1990 onboard the R/V ATALANTE
- RESON Seabat 7111 since 2008 onboard the R/V POURQUOI PAS?
- Medium depths:
- SIMRAD EM 300 since 31st January 2000 onboard the R/V SUROÎT
- Shallow waters:
- SIMRAD EM 950 / EM 1000 since 1995 (mobile BASSOP container)
- RESON Seabat 7150 since 2008 onboard the R/V POURQUOI PAS?
- Monobeam bathymetry
- FURUNO 200 KHz onboard the R/V ATALANTE
- SIMRAD EA500 onboard the R/V SUROIT and the R/V THALASSA
- SIMRAD EA600 onboard the R/V POURQUOI PAS?
- Deep ocean:
More information on the website of the French oceanographic fleet.
Processing and issues
The processing of the data acquired by multibeam echosounders fulfils a two-fold purpose:
- generation of a digital elevation model, resulting from bathymetric measurements
- composition of an acoustic image mosaic, resulting from the reflectivity of the acoustic signal off the bottom.

©Ifremer
A digital elevation model is a regular grid of bathymetric values interpolated from raw data from the surrounding area. The stages of bathymetric data processing are as follows: control, validation and filtering of raw data; generation of the digital elevation model; smoothing of the digital elevation model.
Final results: products and synthesis
Geological surveys are conducted by multibeam echosounders to obtain precise information on the morphology and nature of the seabed. The results of the analysis and interpretation of digital elevation models, acoustic image mosaics and samples are presented in map form:
- morpho-bathymetric maps showing the seabed relief;
- maps of surface formations and sedimentological maps showing the nature and organisation of sea floor components;
- habitat maps illustrating the distribution of benthic fauna across the sea floor.

©Ifremer
The scale of representation of this information varies depending on the acquisition devices used, the water depth and the size of the area studied. Through geological surveys in areas on the continental shelf, and more specifically in coastal areas, we can produce maps at a scale of 1:20,000, while a near-systematic review of the continental shelf and continental slope gives morphosedimentary results at a scale of 1:100,000.
To find out more about the techniques used to map the continental shelf, see the Guide général by Claire Rollet, Cecile Breton, Benoit Loubrieu and Catherine Satra Le Bris (2010).
Contact
For all further enquiries, please contact the SISMER service (sismer@ifremer.fr).
