The principle
In compliance with the international standards defined by UNESCO's IOC, ICES and the European Commission (MAST programme) for oceanographic data archiving, SISMER performs quality checks (QC) on data and metadata. These QCs are divided into three main groups:
- QC 0: Checking of the format and information
- QC 1: Checking of the data and location - Navigation check (metadata)
- QC 2: Checking of observations (data).
The QCs are adapted to each type of data. In most cases, they include automatic/objective checks and visual/subjective checks.
An example
Let's take the example of quality checks performed using the expert software SCOOP.
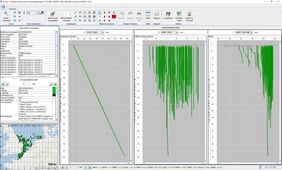
Each dataset of vertical profiles or time series undergoes a series of automatic checks. These automatic checks result in a quality indicator assigned to each numerical value in the data files.
Then, the measurement points are displayed on the screen using a colour code indicating the corresponding quality flag (GTSPP scale):

These quality flags are then validated or corrected manually by the operator who takes into account the overall consistency of the dataset and the remarks of the person responsible for the data.
QC0: File format check
- Detection of file format errors
- Completeness of the information
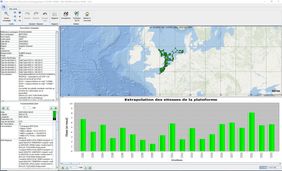
QC1: Metadata check (checking of the ship route and station headers)
The user detects the following main errors:
- Duplicate stations in the base
- Duplicates within the file
- Onshore positions:
- Spikes in ship speed (due to inaccurate geographic and/or temporal position of the station)
- Inconsistency between maximum depth measured by the station and bathymetry.
QC2: Data checks
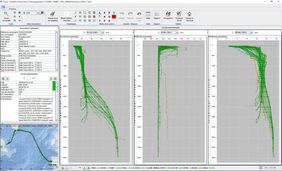
Each parameter measured is compared with a reference climatology. Examples of available climatologies:
- for vertical profiles: LEVITUS, REYNAUD, MEDAR/MEDATLAS
- for time series: mean and standard deviation of the series during check.
The user can then see the errors detected displayed on the graphic interface:
- Measurement spikes
- Constant values
- Density inversion
- Measurement point excluding climatology
- Impossible regional values by comparison with pre-existing statistics.
|
|
|
|


